Page 262 - BTSGroup ONE REPORT 2021/22_EN
P. 262

260                l  Introduction  l  Nature of Business  l  Organisation and Shareholding Structure  l  Business Review  l  Corporate Governance  l  Financial Statements  l  Other Information  l


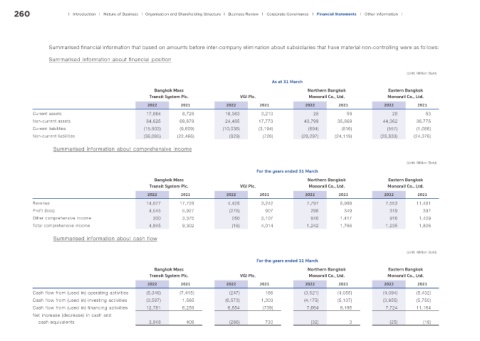
                  Summarised financial information that based on amounts before inter-company elimination about subsidiaries that have material non-controlling were as follows:

                  Summarised information about financial position

                                                                                                                                               (Unit: Million Baht)
                                                                                                As at 31 March
                                                       Bangkok Mass                                         Northern Bangkok            Eastern Bangkok
                                                     Transit System Plc.             VGI Plc.                Monorail Co., Ltd.         Monorail Co., Ltd.
                                                    2022        2021            2022        2021           2022        2021            2022        2021
            Current assets                          17,864       8,726         16,363       3,210             28          59              28         53
            Non-current assets                      84,625      69,678         24,485      17,773          43,799      35,869         44,362      36,775
            Current liabilities                    (15,903)     (9,609)        (10,036)    (3,194)          (694)       (816)           (557)     (1,086)
            Non-current liabilities                (36,095)    (22,466)          (829)       (726)        (28,297)    (24,119)        (28,833)   (24,376)
                    Summarised information about comprehensive income


                                                                                                                                               (Unit: Million Baht)
                                                                                          For the years ended 31 March
                                                       Bangkok Mass                                         Northern Bangkok            Eastern Bangkok
                                                     Transit System Plc.             VGI Plc.                Monorail Co., Ltd.         Monorail Co., Ltd.
                                                    2022        2021            2022        2021           2022        2021            2022        2021
            Revenue                                 14,077      17,728          4,426       3,242           7,797       8,988          7,553      11,481
            Profit (loss)                            4,545       5,927           (276)       907             296         349             319        397
            Other comprehensive income                300        3,375            260       3,107            946        1,417            916       1,409
            Total comprehensive income               4,845       9,302            (16)      4,014           1,242       1,766          1,235       1,806

                    Summarised information about cash flow

                                                                                                                                               (Unit: Million Baht)
                                                                                          For the years ended 31 March
                                                       Bangkok Mass                                         Northern Bangkok            Eastern Bangkok
                                                     Transit System Plc.             VGI Plc.                Monorail Co., Ltd.         Monorail Co., Ltd.
                                                    2022        2021            2022        2021           2022        2021            2022        2021
            Cash flow from (used in) operating activities  (5,346)  (7,415)      (247)       166           (3,521)     (4,055)         (4,094)    (5,432)
            Cash flow from (used in) investing activities  (3,587)  1,565       (6,573)     1,303          (4,175)     (5,137)         (3,655)    (5,750)
            Cash flow from (used in) financing activities  12,781  6,258        6,554        (739)          7,664       9,195          7,724      11,164
            Net increase (decrease) in cash and
              cash equivalents                       3,848        408            (266)       730             (32)          3             (25)       (18)
   257   258   259   260   261   262   263   264   265   266   267