
Page 44 - BTSGroup ONE REPORT 2021/22_EN
P. 44
42 l Introduction l Nature of Business l Organisation and Shareholding Structure l Business Review l Corporate Governance l Financial Statements l Other Information l
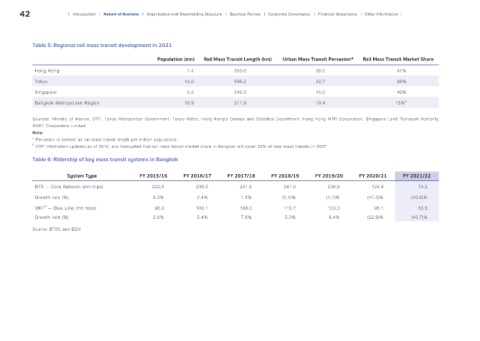
Table 5: Regional rail mass transit development in 2021
Population (mn) Rail Mass Transit Length (km) Urban Mass Transit Pervasion* Rail Mass Transit Market Share
Hong Kong 7.4 283.0 38.2 47%
Tokyo 14.0 596.2 42.7 48%
Singapore 5.5 245.3 45.0 46%
Bangkok Metropolitan Region 10.9 211.9 19.4 13% 5
Sources: Ministry of Interior, OTP, Tokyo Metropolitan Government, Tokyo Metro, Hong Kong’s Census and Statistics Department, Hong Kong MTR Corporation, Singapore Land Transport Authority,
SMRT Corporation Limited
Note:
* Pervasion is defined as rail mass transit length per million populations.
5 OTP information updated as of 2018, and forecasted that rail mass transit market share in Bangkok will cover 33% of total mass transits in 2037
Table 6: Ridership of key mass transit systems in Bangkok
System Type FY 2015/16 FY 2016/17 FY 2017/18 FY 2018/19 FY 2019/20 FY 2020/21 FY 2021/22
BTS – Core Network (mn trips) 232.5 238.0 241.2 241.0 236.9 124.9 74.2
Growth rate (%) 6.3% 2.4% 1.3% (0.1)% (1.7)% (47.3)% (40.6)%
6
MRT – Blue Line (mn trips) 95.0 100.1 108.0 113.7 123.3 95.1 53.5
Growth rate (%) 2.8% 5.4% 7.8% 5.3% 8.4% (22.9)% (43.7)%
Source: BTSC and BEM