Page 322 - BTSGroup ONE REPORT 2021/22_EN
P. 322

320                l  Introduction  l  Nature of Business  l  Organisation and Shareholding Structure  l  Business Review  l  Corporate Governance  l  Financial Statements  l  Other Information  l


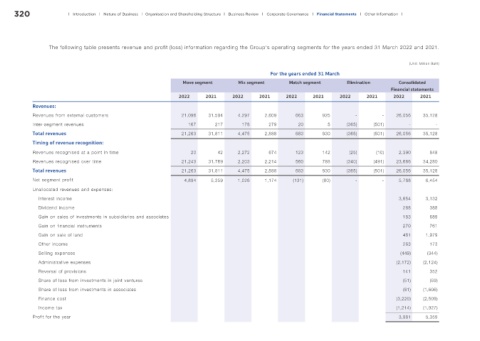
                  The following table presents revenue and profit (loss) information regarding the Group’s operating segments for the years ended 31 March 2022 and 2021.


                                                                                                                                                (Unit: Million Baht)

                                                                                               For the years ended 31 March
                                                                 Move segment       Mix segment       Match segment       Elimination       Consolidated
                                                                                                                                         Financial statements
                                                               2022      2021     2022     2021      2022     2021     2022      2021     2022     2021
            Revenues:
            Revenues from external customers                    21,096    31,594    4,297    2,609      663      925         -        -    26,056   35,128
            Inter-segment revenues                                 167      217      178       279       20        5      (365)    (501)        -        -

            Total revenues                                      21,263    31,811    4,475    2,888      683      930      (365)    (501)   26,056   35,128
            Timing of revenue recognition:
            Revenues recognised at a point in time                 20        42     2,272      674      123      142       (25)     (10)    2,390      848
            Revenues recognised over time                       21,243    31,769    2,203    2,214      560      788      (340)    (491)   23,666   34,280

            Total revenues                                      21,263    31,811    4,475    2,888      683      930      (365)    (501)   26,056   35,128
            Net segment profit                                   4,894     5,359    1,026    1,174     (131)     (80)        -        -     5,788    6,454
            Unallocated revenues and expenses:
              Interest income                                                                                                               3,654    3,132
              Dividend income                                                                                                                288       388
              Gain on sales of investments in subsidiaries and associates                                                                    183       689
              Gain on financial instruments                                                                                                  270       761
              Gain on sale of land                                                                                                           481     1,979
              Other income                                                                                                                   263       173
              Selling expenses                                                                                                               (449)    (344)
              Administrative expenses                                                                                                      (2,172)  (2,124)
              Reversal of provisions                                                                                                         141       352
              Share of loss from investments in joint ventures                                                                               (51)      (59)
              Share of loss from investments in associates                                                                                   (81)   (1,606)
              Finance cost                                                                                                                 (3,220)  (2,509)
              Income tax                                                                                                                   (1,214)  (1,927)
            Profit for the year                                                                                                             3,881    5,359
   317   318   319   320   321   322   323   324   325   326   327