Page 78 - BTSGroup ONE REPORT 2021/22_EN
P. 78

76               l  Introduction  l  Nature of Business  l  Organisation and Shareholding Structure  l  Business Review  l Corporate Governance l Financial Statements l Other Information l


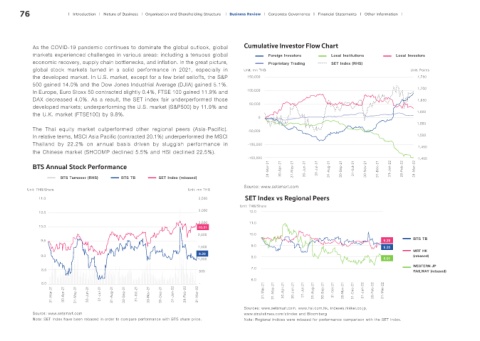
            As the COVID-19 pandemic continues to dominate the global outlook, global   Cumulative Investor Flow Chart
            markets experienced challenges in various areas: including a tenuous global        Foreign Investors    Local Institutions     Local Investors
            economic recovery, supply chain bottlenecks, and inflation. In the great picture,   Proprietary Trading  SET Index (RHS)
            global stock markets turned in a solid performance in 2021, especially in   Unit: mn THB                                            Unit: Points
            the developed market. In U.S. market, except for a few brief selloffs, the S&P   150,000                                               1,750
            500 gained 14.0% and the Dow Jones Industrial Average (DJIA) gained 5.1%.
            In Europe, Euro Stoxx 50 contracted slightly 0.4%, FTSE 100 gained 11.9% and   100,000                                                 1,700
            DAX decreased 4.0%. As a result, the SET index fair underperformed those                                                               1,650
            developed markets; underperforming the U.S. market (S&P500) by 11.9% and    50,000
            the U.K. market (FTSE100) by 9.8%.                                             0                                                      1,600
                                                                                                                                                  1,550
            The Thai equity market outperformed other regional peers (Asia-Pacific).   -50,000
            In relative terms, MSCI Asia Pacific (contracted 20.1%) underperformed the MSCI                                                       1,500
            Thailand by 22.2% on annual basis driven by sluggish performance in        -100,000                                                    1,450
            the Chinese market (SHCOMP declined 5.5% and HSI declined 22.5%).
                                                                                       -150,000                                                    1,400
                                                                                               31-Mar-21  30-Apr-21  31-May-21  30-Jun-21  31-Jul-21  31-Aug-21  30-Sep-21  31-0ct-21  30-Nov-21  31-Dec-21  31-Jan-22  28-Feb-22   31-Mar-22
            BTS Annual Stock Performance
                      BTS Turnover (RHS)   BTS TB       SET Index (rebased)
                                                                                      Source: www.setsmart.com
          Unit: THB/Share                                         Unit: mn THB
               11.0                                                   3,500           SET Index vs Regional Peers
                                                                                     Unit: THB/Share
               10.5                                                   3,000             12.0
                                                                      2,500             11.0
               10.0                                                   10.31
                                                                      2,000             10.0
               9.5                                                                                                                     9.28      BTS TB
                                                                      1,500              9.0                                           9.20      MRT HK
               9.0                                                    9.20               8.0                                                     (rebased)
                                                                      1,000                                                            8.01
                                                                                                                                                 WESTERN JP
               8.5                                                    500                7.0                                                     RAILWAY (rebased)
                                                                                         6.0
               8.0                                                    -
                   31-Mar-21  30-Apr-21  31-May-21  30-Jun-21  31-Jul-21  31-Aug-21  30-Sep-21  31-0ct-21  30-Nov-21  31-Dec-21  31-Jan-22  28-Feb-22   31-Mar-22  31-Mar-21  31-May-21  30-Apr-21  30-Jun-21  31-Jul-21  31-Aug-21  30-Sep-21  31-0ct-21  30-Nov-21  31-Dec-21  31-Jan-22  28-Feb-22   31-Mar-22


                                                                                      Sources: www.setsmart.com, www.hsi.com.hk, indexes.nikkei.co.jp,
            Source: www.setsmart.com                                                  www.straitstimes.com/stindex and Bloomberg
            Note: SET Index have been rebased in order to compare performance with BTS share price.  Note: Regional indices were rebased for performance comparison with the SET Index.
   73   74   75   76   77   78   79   80   81   82   83