
Page 204 - BTSGroup ONE REPORT 2021/22_EN
P. 204
202 l Introduction l Nature of Business l Organisation and Shareholding Structure l Business Review l Corporate Governance l Financial Statements l Other Information l
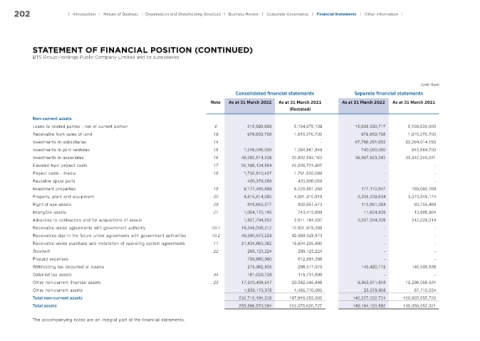
STATEMENT OF FINANCIAL POSITION (CONTINUED)
BTS Group Holdings Public Company Limited and its subsidiaries
(Unit: Baht)
Consolidated f nancial statements Separate f nancial statements
Note As at 31 March 2022 As at 31 March 2021 As at 31 March 2022 As at 31 March 2021
(Restated)
Non-current assets
Loans to related parties - net of current portion 6 215,593,609 5,154,375,109 15,635,330,717 5,128,500,000
Receivable from sales of land 19 979,653,708 1,815,270,700 979,653,708 1,815,270,700
Investments in subsidiaries 14 - - 67,766,251,653 63,264,014,153
Investments in joint ventures 15 1,248,046,030 1,294,861,849 740,000,000 843,564,700
Investments in associates 16 48,262,514,239 32,832,593,163 39,867,823,262 33,342,246,031
Elevated train project costs 17 52,198,134,564 42,535,774,987 - -
Project costs - media 18 1,735,810,427 1,791,628,099 - -
Reusable spare parts 420,379,268 433,606,059 - -
Investment properties 19 9,177,465,899 6,228,881,288 177,110,847 169,092,769
Property, plant and equipment 20 4,815,814,092 4,891,910,819 3,305,239,634 3,373,819,174
Right-of-use assets 29 618,653,277 802,657,573 113,881,384 93,755,489
Intangible assets 21 1,054,170,195 743,413,699 11,624,839 13,686,984
Advances to contractors and for acquisitions of assets 1,827,794,552 2,611,184,297 3,507,334,329 312,329,319
Receivable under agreements with government authority 10.1 18,348,036,312 10,801,979,398 - -
Receivables due in the future under agreements with government authorities 10.2 49,590,973,224 42,999,328,873 - -
Receivable under purchase and installation of operating system agreements 11 21,434,663,362 19,834,205,895 - -
Goodwill 22 289,123,224 289,123,224 - -
Prepaid expenses 709,680,990 612,891,366 - -
Withholding tax deducted at source 275,982,635 296,517,970 145,420,772 145,509,836
Deferred tax assets 44 161,029,726 119,731,899 - -
Other non-current financial assets 23 17,510,498,517 20,342,545,848 9,953,971,618 12,296,056,531
Other non-current assets 1,839,173,378 1,485,770,965 23,379,958 87,710,034
Total non-current assets 232,713,191,228 197,918,253,080 142,227,022,721 120,885,555,720
Total assets 255,866,570,091 212,075,620,727 149,164,120,562 130,358,052,321
The accompanying notes are an integral part of the financial statements.