Page 207 - BTSGroup ONE REPORT 2021/22_EN
P. 207

BTS Group Holdings Public Company Limited                                                                                   6.3 Financial Statements  205
               Annual Report 2021/22


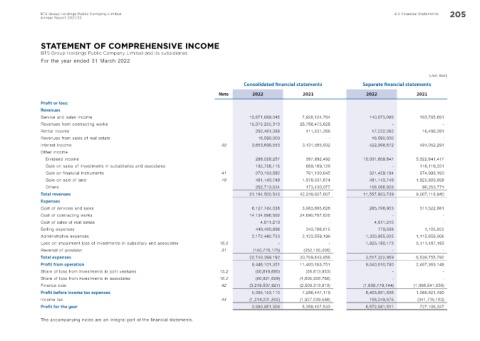
               STATEMENT OF COMPREHENSIVE INCOME

               BTS Group Holdings Public Company Limited and its subsidiaries
               For the year ended 31 March 2022

                                                                                                                                                       (Unit: Baht)
                                                                                      Consolidated f nancial statements        Separate f nancial statements
                                                                             Note        2022              2021                  2022             2021
               Prof t or loss:
               Revenues
               Service and sales income                                                 10,671,689,045     7,928,124,764          140,673,098       163,765,661
               Revenues from contracting works                                          15,075,255,313    26,788,475,628                  -                 -
               Rental income                                                              292,461,386       411,531,266            17,222,262        16,486,391
               Revenues from sales of real estate                                          16,590,000               -              16,590,000               -
               Interest income                                                40         3,653,699,553     3,131,565,932          422,998,672       491,052,291
               Other income
                  Dividend income                                                         288,028,257       387,892,492         10,001,809,847    5,322,641,477
                  Gain on sales of investments in subsidiaries and associates              182,756,115      689,169,128                   -         116,116,331
                  Gain on financial instruments                               41           270,163,592      761,130,645           321,429,184       874,993,160
                  Gain on sale of land                                        19          481,143,748      1,978,507,674          481,143,748     1,925,809,858
                  Others                                                                   262,713,534      173,430,077           156,066,928        96,253,771
               Total revenues                                                           31,194,500,543    42,249,827,607        11,557,933,739    9,007,118,940
               Expenses
               Cost of services and sales                                                6,127,744,036     3,983,685,626          285,796,953       311,522,881
               Cost of contracting works                                                14,134,896,502    24,690,787,625                  -                 -
               Cost of sales of real estate                                                 4,611,210               -               4,611,210               -
               Selling expenses                                                           449,480,896       343,766,815              779,598         1,105,922
               Administrative expenses                                                   2,172,442,723     2,123,559,196         1,300,955,025    1,115,659,806
               Loss on impairment loss of investments in subsidiary and associates  16.5          -                 -            1,925,180,173    5,111,467,183
               Reversal of provision                                          31          (140,776,175)    (352,155,406)                  -                 -
               Total expenses                                                           22,748,399,192    30,789,643,856         3,517,322,959    6,539,755,792
               Prof t from operation                                                     8,446,101,351    11,460,183,751         8,040,610,780    2,467,363,148
               Share of loss from investments in joint ventures              15.2          (50,618,685)     (58,613,953)                  -                 -
               Share of loss from investments in associates                  16.2          (80,821,629)   (1,605,808,766)                 -                 -
               Finance cost                                                   42        (3,219,507,927)   (2,509,313,913)       (1,636,779,144)   (1,398,541,658)

               Prof t before income tax expenses                                         5,095,153,110     7,286,447,119         6,403,831,636    1,068,821,490
               Income tax                                                     44        (1,214,201,802)   (1,927,039,586)         168,249,875      (341,715,163)
               Prof t for the year                                                       3,880,951,308     5,359,407,533         6,572,081,511      727,106,327

               The accompanying notes are an integral part of the financial statements.
   202   203   204   205   206   207   208   209   210   211   212