Page 217 - BTSGroup ONE REPORT 2021/22_EN
P. 217

BTS Group Holdings Public Company Limited                                                                                   6.3 Financial Statements  215
               Annual Report 2021/22
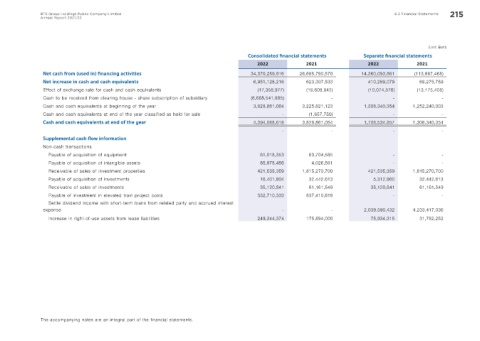


                                                                                                                                                      (Unit: Baht)
                                                                                       Consolidated f nancial statements        Separate f nancial statements
                                                                                           2022             2021                 2022             2021
                Net cash from (used in) f nancing activities                             34,370,259,816    26,685,790,570      14,360,093,861     (113,667,468)
                Net increase in cash and cash equivalents                                 6,951,128,216     623,307,533           410,269,079       69,275,759
                Effect of exchange rate for cash and cash equivalents                      (17,358,977)     (18,609,842)          (10,074,576)     (13,175,408)
                Cash to be received from clearing house - share subscription of subsidiary   (6,668,541,685)         -                    -                -
                Cash and cash equivalents at beginning of the year                        3,828,861,064    3,225,821,123        1,308,340,354    1,252,240,003
                Cash and cash equivalents at end of the year classified as held for sale            -        (1,657,750)                  -                -
                Cash and cash equivalents at end of the year                              4,094,088,618    3,828,861,064        1,708,534,857    1,308,340,354
                                                                                                    -                -                    -                -
                Supplemental cash f ow information
                Non-cash transactions
                   Payable of acquisition of equipment                                      61,018,353       63,704,585                   -                -
                   Payable of acquisition of intangible assets                              65,975,456        4,026,581                   -                -
                   Receivable of sales of investment properties                            421,535,359     1,815,270,700          421,535,359    1,815,270,700
                   Payable of acquisition of investments                                    16,401,804       32,442,613             5,312,960       32,442,613
                   Receivable of sales of investments                                       35,120,841       61,161,549            35,120,841       61,161,549
                   Payable of investment in elevated train project costs                   332,710,333      837,410,616                   -                -
                   Settle dividend income with short-term loans from related party and accrued interest
                expense                                                                             -                -          2,039,590,432    4,233,417,036
                   Increase in right-of-use assets from lease liabilities                  249,344,374      175,894,000           75,934,315        31,782,252


               The accompanying notes are an integral part of the financial statements.
   212   213   214   215   216   217   218   219   220   221   222