Page 116 - BTSGroup ONE REPORT 2021/22_EN
P. 116

114               l  Introduction  l  Nature of Business  l  Organisation and Shareholding Structure  l  Business Review  l Corporate Governance l Financial Statements l Other Information l


            Key Financial Rations

                                                                                             FY 2021/22            FY 2020/21             FY 2019/20 A
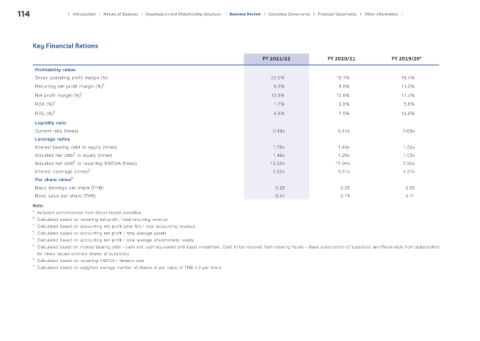
             Profitability ratios
             Gross operating profit margin (%)                                                 22.2%                  18.1%                  18.4%
             Recurring net profit margin (%) B                                                  9.3%                   9.6%                  11.3%
             Net profit margin (%) C                                                           12.3%                  10.8%                  17.4%
             ROA (%) D                                                                          1.7%                   2.8%                   5.6%
             ROE (%) E                                                                          4.8%                   7.5%                  14.8%
             Liquidity ratio
             Current ratio (times)                                                              0.49x                  0.44x                  0.68x
             Leverage ratios
             Interest bearing debt to equity (times)                                            1.76x                  1.49x                  1.32x
             Adjusted net debt  to equity (times)                                               1.46x                  1.28x                  1.05x
                           F
             Adjusted net debt  to recurring EBITDA (times)                                    15.50x                 11.04x                  7.35x
                           F
             Interest coverage (times) G                                                        2.52x                  3.51x                  4.27x
             Per share ratios H
             Basic earnings per share (THB)                                                      0.29                   0.35                  0.65
             Book value per share (THB)                                                          6.54                   5.78                  5.11
            Note:
            A   Included performances from discontinued operation
            B   Calculated based on recurring net profit / total recurring revenue
            C   Calculated based on accounting net profit (after MI) / total accounting revenue
            D   Calculated based on accounting net profit / total average assets
            E   Calculated based on accounting net profit / total average shareholders’ equity
            F   Calculated based on interest bearing debt - cash and cash equivalent and liquid investment, Cash to be received from clearing house - share subscription of subsidiary and Receivable from subscription
              for newly issued ordinary shares of subsidiary
            G   Calculated based on recurring EBITDA / finance cost
            H   Calculated based on weighted average number of shares at par value of THB 4.0 per share
   111   112   113   114   115   116   117   118   119   120   121