Page 119 - BTSGroup ONE REPORT 2021/22_EN
P. 119

BTS Group Holdings Public Company Limited                                                                        4.4 Management Discussion and Analysis  117
               Annual Report 2021/22
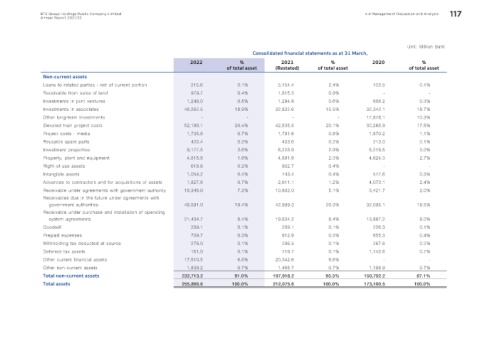


                                                                                                                                               Unit: Million Baht
                                                                                         Consolidated financial statements as at 31 March,
                                                                   2022              %             2021             %              2020             %
                                                                                of total asset   (Restated)     of total asset                  of total asset
                Non-current assets
                Loans to related parties - net of current portion   215.6           0.1%          5,154.4           2.4%           122.5           0.1%
                Receivable from sales of land                       979.7           0.4%          1,815.3           0.9%               -               -
                Investments in joint ventures                     1,248.0           0.5%          1,294.9           0.6%           608.2           0.3%
                Investments in associates                        48,262.5          18.9%         32,832.6          15.5%         32,342.1         18.7%
                Other long-term investments                            -               -               -               -         17,878.1         10.3%
                Elevated train project costs                     52,198.1          20.4%         42,535.8          20.1%         30,268.9         17.5%
                Project costs - media                             1,735.8           0.7%          1,791.6           0.8%          1,870.2          1.1%
                Reusable spare parts                                420.4           0.2%           433.6            0.2%           213.0           0.1%
                Investment properties                             9,177.5           3.6%          6,228.9           2.9%          5,219.5          3.0%
                Property, plant and equipment                     4,815.8           1.9%          4,891.9           2.3%          4,624.3          2.7%
                Right-of-use assets                                 618.6           0.2%            802.7           0.4%               -               -
                Intangible assets                                 1,054.2           0.4%           743.4            0.4%           577.6           0.3%
                Advances to contractors and for acquisitions of assets  1,827.8     0.7%          2,611.1           1.2%          4,073.1          2.4%
                Receivable under agreements with government authority  18,348.0     7.2%         10,802.0           5.1%          3,421.7          2.0%
                Receivables due in the future under agreements with
                  government authorities                         49,591.0          19.4%         42,999.3          20.3%         32,095.1         18.5%
                Receivable under purchase and installation of operating
                  system agreements                              21,434.7           8.4%         19,834.2           9.4%         13,887.2          8.0%
                Goodwill                                            289.1           0.1%           289.1            0.1%           236.3           0.1%
                Prepaid expenses                                    709.7           0.3%           612.9            0.3%           655.3           0.4%
                Withholding tax deducted at source                  276.0           0.1%           296.5            0.1%           267.6           0.2%
                Deferred tax assets                                 161.0           0.1%           119.7            0.1%          1,142.6          0.7%
                Other current financial assets                   17,510.5           6.8%         20,342.6           9.6%               -               -
                Other non-current assets                          1,839.2           0.7%          1,485.7           0.7%          1,198.9          0.7%
                Total non-current assets                        232,713.2          91.0%        197,918.2          93.3%        150,702.2         87.1%
                Total assets                                    255,866.6         100.0%        212,075.6         100.0%        173,100.5        100.0%
   114   115   116   117   118   119   120   121   122   123   124