Page 122 - BTSGroup ONE REPORT 2021/22_EN
P. 122

120                l  Introduction  l  Nature of Business  l  Organisation and Shareholding Structure  l  Business Review  l Corporate Governance l Financial Statements l Other Information l


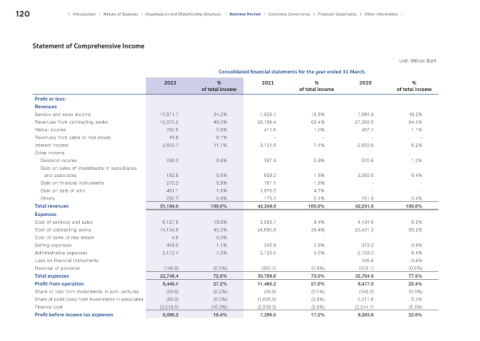
            Statement of Comprehensive Income

                                                                                                                                            Unit: Million Baht

                                                                             Consolidated financial statements for the year ended 31 March,

                                                          2022               %              2021               %              2020               %
                                                                       of total income                   of total income                   of total income
             Profit or loss:
             Revenues
             Service and sales income                    10,671.7          34.2%            7,928.1          18.8%            7,684.9           18.2%
             Revenues from contracting works             15,075.2          48.3%           26,788.4          63.4%           27,262.8          64.5%
             Rental income                                 292.5            0.9%             411.6            1.0%             457.1            1.1%
             Revenues from sales of real estate             16.6            0.1%                 -                -                -                -
             Interest income                              3,653.7          11.7%            3,131.6           7.4%            2,603.6           6.2%
             Other income
               Dividend income                             288.0            0.9%             387.9            0.9%             520.5            1.2%
               Gain on sales of investments in subsidiaries
                 and associates                            182.8            0.6%             689.2            1.6%            3,560.9           8.4%
               Gain on financial instruments               270.2             0.9%            761.1             1.8%                -                -
               Gain on sale of land                        481.1             1.5%           1,978.5            4.7%                -                -
               Others                                      262.7            0.9%             173.4            0.4%             151.8            0.4%
             Total revenues                              31,194.5         100.0%           42,249.8         100.0%           42,241.6          100.0%
             Expenses
             Cost of services and sales                   6,127.8          19.6%            3,983.7           9.4%            4,134.6           9.8%
             Cost of contracting works                   14,134.9          45.3%           24,690.8          58.4%           25,431.3           60.2%
             Cost of sales of real estate                    4.6            0.0%                 -                -                -                -
             Selling expenses                              449.5            1.4%             343.8            0.8%             373.0            0.9%
             Administrative expenses                      2,172.4           7.0%            2,123.5           5.0%            2,703.0           6.4%
             Loss on financial instruments                     -                -                -                -            345.8             0.8%
             Reversal of provision                        (140.8)           (0.5%)          (352.2)           (0.8%)          (223.1)           (0.5%)
             Total expenses                              22,748.4          72.8%           30,789.6          73.0%           32,764.6          77.6%
             Profit from operation                        8,446.1          27.2%           11,460.2          27.0%            9,477.0          22.4%
             Share of loss from investments in joint ventures  (50.6)       (0.2%)           (58.6)           (0.1%)          (140.3)           (0.3%)
             Share of profit (loss) from investments in associates  (80.8)  (0.3%)         (1,605.8)          (3.8%)          2,211.6           5.2%
             Finance cost                                (3,219.5)         (10.3%)         (2,509.3)          (5.9%)         (2,244.7)          (5.3%)
             Profit before income tax expenses            5,095.2          16.4%            7,286.5          17.2%            9,303.6          22.0%
   117   118   119   120   121   122   123   124   125   126   127