Page 120 - BTSGroup ONE REPORT 2021/22_EN
P. 120

118               l  Introduction  l  Nature of Business  l  Organisation and Shareholding Structure  l  Business Review  l Corporate Governance l Financial Statements l Other Information l
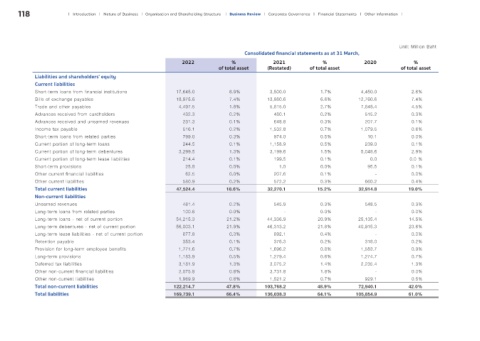


                                                                                                                                            Unit: Million Baht
                                                                                      Consolidated financial statements as at 31 March,
                                                                2022              %             2021             %              2020             %
                                                                             of total asset   (Restated)     of total asset                  of total asset
             Liabilities and shareholders' equity
             Current liabilities
             Short-term loans from financial institutions     17,645.0           6.9%          3,500.0           1.7%          4,450.0          2.6%
             Bills of exchange payables                       18,975.6           7.4%         13,980.6           6.6%         12,760.6          7.4%
             Trade and other payables                          4,497.5           1.8%          5,815.0           2.7%          7,848.4          4.5%
             Advances received from cardholders                  432.3           0.2%           480.1            0.2%           515.2           0.3%
             Advances received and unearned revenues             231.3           0.1%           648.8            0.3%           207.7           0.1%
             Income tax payable                                  516.1           0.2%          1,532.8           0.7%          1,079.5          0.6%
             Short-term loans from related parties               799.0           0.3%           974.0            0.5%            10.1           0.0%
             Current portion of long-term loans                  244.5           0.1%          1,158.9           0.5%           239.0           0.1%
             Current portion of long-term debentures           3,299.5           1.3%          3,199.6           1.5%          5,048.6          2.9%
             Current portion of long-term lease liabilities      214.4           0.1%           199.5            0.1%             0.0           0.0 %
             Short-term provisions                                25.8           0.0%             1.0            0.0%            95.5           0.1%
             Other current financial liabilities                  62.5           0.0%           207.6            0.1%               -            0.0%
             Other current liabilities                           580.9           0.2%           572.2            0.3%           660.2           0.4%
             Total current liabilities                        47,524.4          18.6%         32,270.1          15.2%         32,914.8         19.0%
             Non-current liabilities
             Unearned revenues                                   481.4           0.2%           545.9            0.3%           548.5           0.3%
             Long-term loans from related parties                100.6           0.0%               -            0.0%               -            0.0%
             Long-term loans - net of current portion         54,215.3          21.2%         44,336.9          20.9%         25,135.4          14.5%
             Long-term debentures - net of current portion    56,003.1          21.9%         46,313.2          21.8%         40,915.3          23.6%
             Long-term lease liabilities - net of current portion  877.8         0.3%            892.1           0.4%               -           0.0%
             Retention payable                                   353.4           0.1%           376.3            0.2%           318.0           0.2%
             Provision for long-term employee benefits         1,771.6           0.7%          1,696.2           0.8%          1,583.7          0.9%
             Long-term provisions                              1,183.9           0.5%          1,279.4           0.6%          1,274.7          0.7%
             Deferred tax liabilities                          3,181.9           1.3%          3,075.2           1.4%          2,235.4          1.3%
             Other non-current financial liabilities           2,075.8           0.8%          3,731.8           1.8%               -            0.0%
             Other non-current liabilities                     1,969.9           0.8%          1,521.2           0.7%           929.1           0.5%
             Total non-current liabilities                    122,214.7         47.8%        103,768.2          48.9%         72,940.1         42.0%
             Total liabilities                                169,739.1         66.4%        136,038.3          64.1%        105,854.9         61.0%
   115   116   117   118   119   120   121   122   123   124   125