Page 118 - BTSGroup ONE REPORT 2021/22_EN
P. 118

116               l  Introduction  l  Nature of Business  l  Organisation and Shareholding Structure  l  Business Review  l Corporate Governance l Financial Statements l Other Information l


            3 Years Historical Key Financial Position and Operating Results

            Analysis of key financial position and performance of this section should be read together with the financial statements for the year 2021/22 the financial statements
            for the year 2020/21 and the financial statements for the year 2019/20 together with the notes to the financial statements for that period.


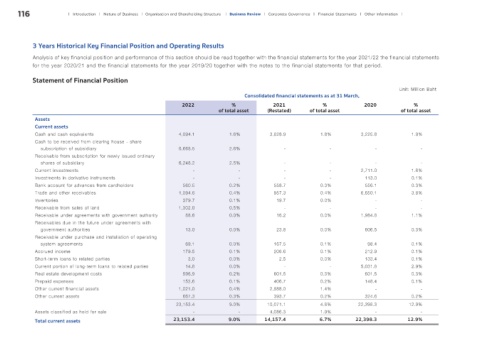
            Statement of Financial Position
                                                                                                                                            Unit: Million Baht
                                                                                      Consolidated financial statements as at 31 March,
                                                                2022              %             2021             %              2020             %
                                                                             of total asset   (Restated)     of total asset                  of total asset
             Assets
             Current assets
             Cash and cash equivalents                         4,094.1           1.6%          3,828.9           1.8%          3,225.8          1.9%
             Cash to be received from clearing house - share
               subscription of subsidiary                      6,668.5           2.6%               -               -               -               -
             Receivable from subscription for newly issued ordinary
               shares of subsidiary                            6,248.2           2.5%               -               -               -               -
             Current investments                                     -              -               -               -          2,711.0          1.6%
             Investments in derivative instruments                   -              -               -               -           113.0           0.1%
             Bank account for advances from cardholders          560.5           0.2%           558.7            0.3%           556.1           0.3%
             Trade and other receivables                       1,094.6           0.4%           957.3            0.4%          6,650.1          3.8%
             Inventories                                         379.7           0.1%            19.7            0.0%               -               -
             Receivable from sales of land                     1,302.0           0.5%               -               -               -               -
             Receivable under agreements with government authority  88.6         0.0%            16.2            0.0%          1,984.8          1.1%
             Receivables due in the future under agreements with
               government authorities                             13.0           0.0%            23.8            0.0%           606.5           0.3%
             Receivable under purchase and installation of operating
               system agreements                                  69.1           0.0%           167.5            0.1%            98.4           0.1%
             Accrued income                                      179.5           0.1%           206.6            0.1%           212.9           0.1%
             Short-term loans to related parties                   3.0           0.0%             2.5            0.0%           133.4           0.1%
             Current portion of long-term loans to related parties  14.8         0.0%               -               -          5,031.8          2.9%
             Real estate development costs                       596.9           0.2%           601.5            0.3%           601.5           0.3%
             Prepaid expenses                                    152.6           0.1%           406.7            0.2%           148.4           0.1%
             Other current financial assets                    1,021.0           0.4%          2,888.0           1.4%               -               -
             Other current assets                                667.3           0.3%           393.7            0.2%           324.6           0.2%
                                                              23,153.4           9.0%         10,071.1           4.8%         22,398.3         12.9%
             Assets classified as held for sale                      -              -          4,086.3           1.9%               -               -

             Total current assets                            23,153.4            9.0%        14,157.4           6.7%         22,398.3          12.9%
   113   114   115   116   117   118   119   120   121   122   123